Regularization: Intuition behind the math
Regularization in Machine Learning is talked about a lot, often indicating that it solves the high variance problem whilst also helping with feature selection. A model is said to have overfit some training data when the error on it is very low but the error on unseen data is very high. This is explained by the formula for variance.
This tells us that, if for some dataset the variance is high, then on average the individual data points are further away from the mean value.
If we were to extend similar thinking to model fitting, a model having high variance means, on average, the individual predictions are further away from the mean prediction.
How can we have multiple predictions? We take our model and fit it to datasets randomly sampled from the original dataset. Intuitively, when models overfit their datasets, the spread of predictions is higher.
This is a problem because the model has generalized poorly and when presented with unknown datasets, predictions are way off.
So, how do we solve this?
Regularization to the rescue
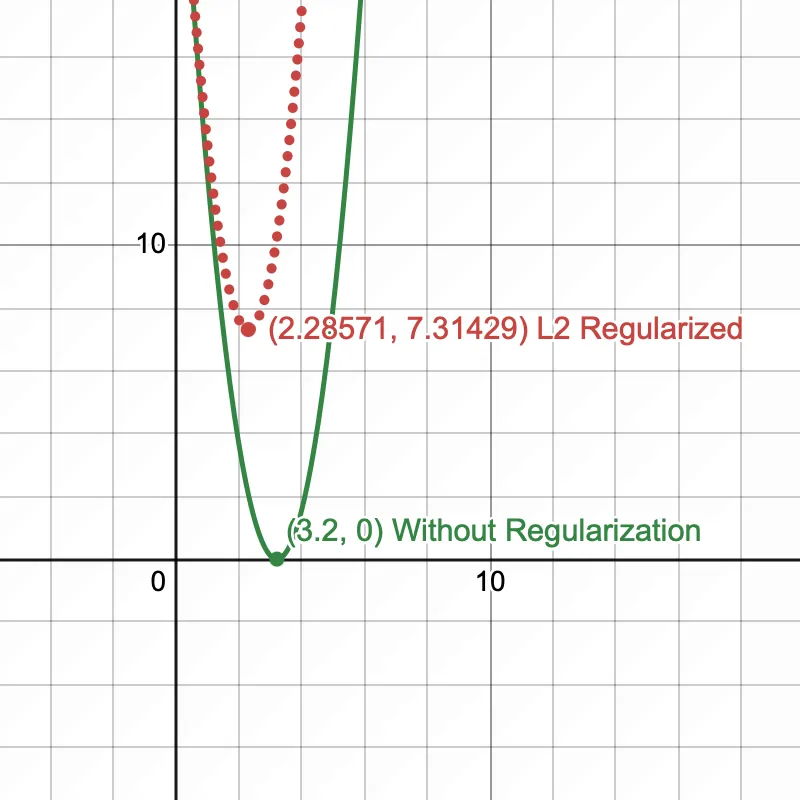
When a model overfits a dataset, the cost is very low i.e., the parameters of our model are too tuned to fit the dataset closely. Can we somehow nudge the cost function, so that the parameters shift from this minima? We can & it's called regularization. Let us take an example function
i.e., = 3.2
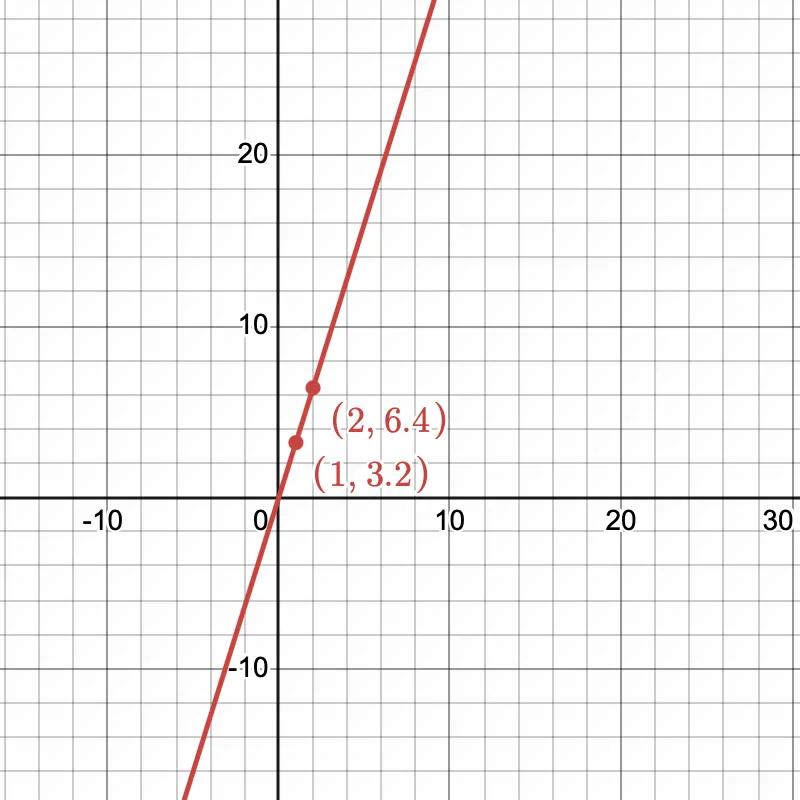
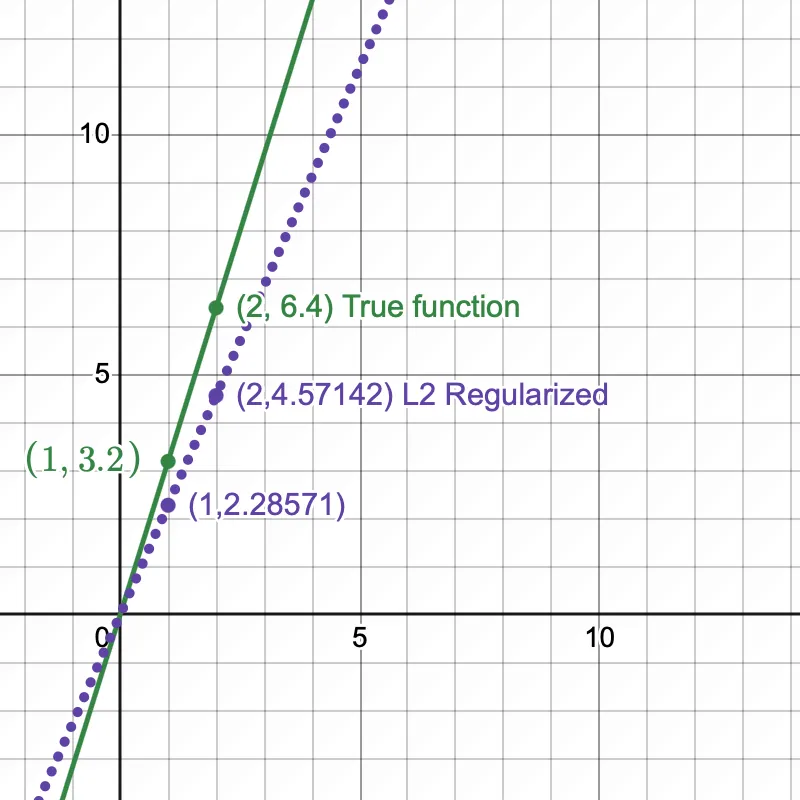
Let the hypothesis function be
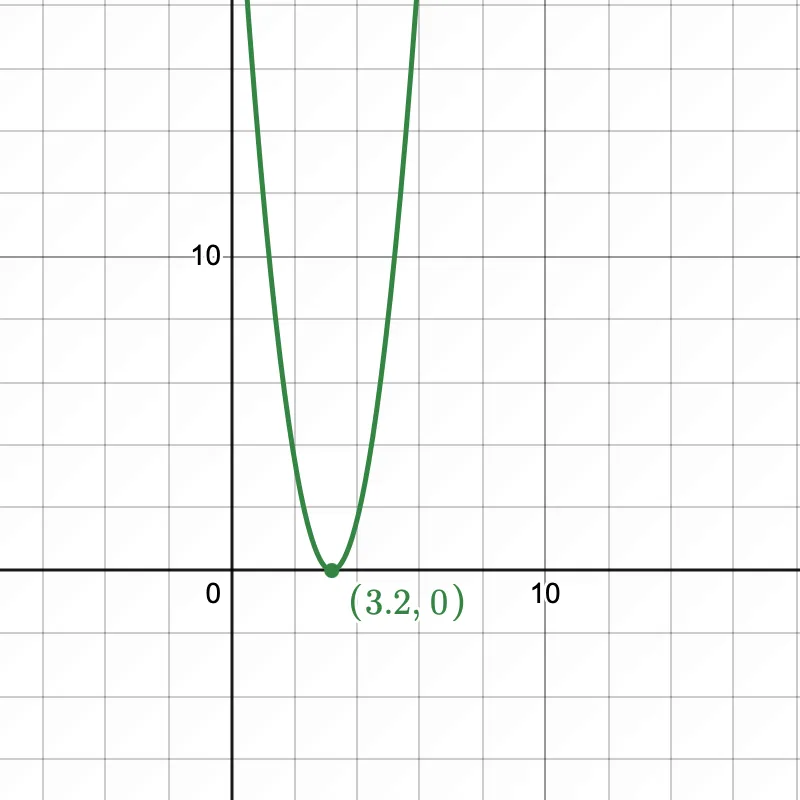
When we train the model, the hypothesis/model parameter would be equal to 3.2. Let's plot the cost function , we can observe that without regularization, the minima lies at 3.2 at which the cost function is 0. We have overfit our model on the dataset!
L1 Regularization
Keeping our hypothesis function the same, let's see what happens to the cost function when we add the L1 regularization term
Let's set = 1
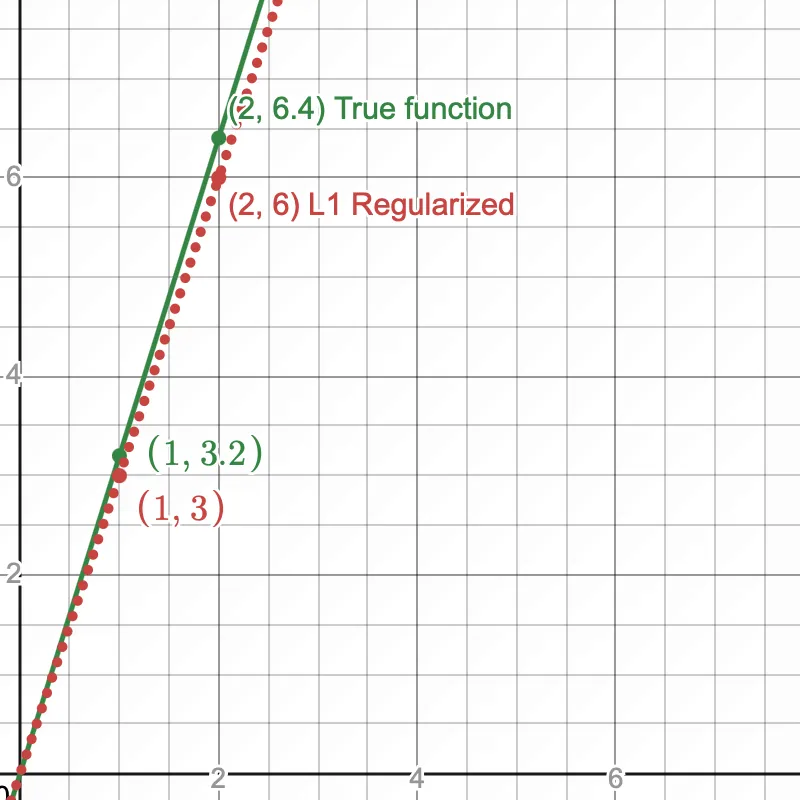
The cost function shifts ever so slightly & the value of which minimizes the cost function is 3. This little nudge prevents the model from overfitting on training data.
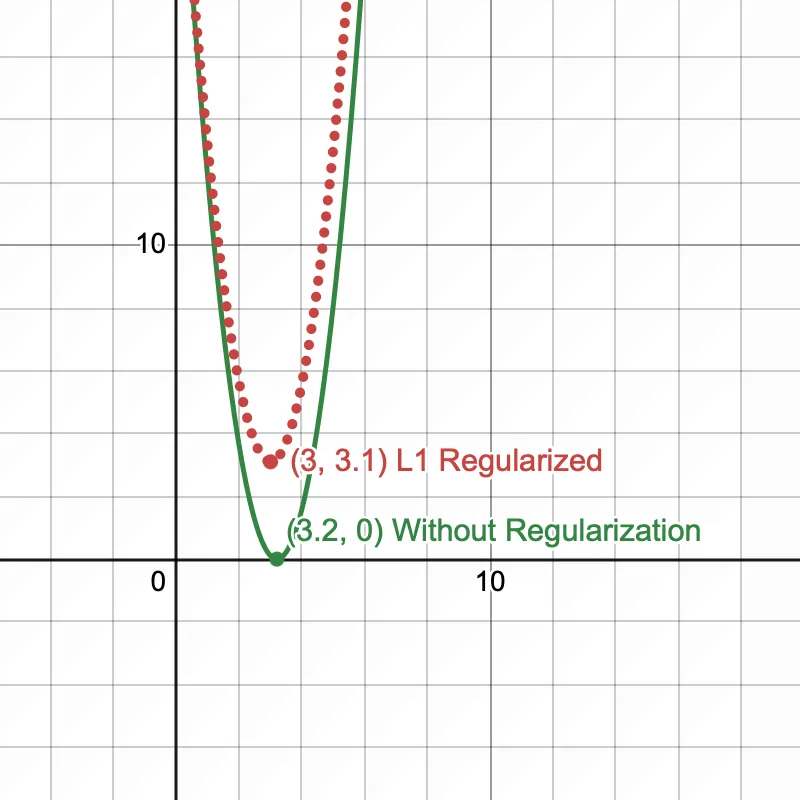
The hypothesis function now shifts from the true function, preventing overfitting.
L2 Regularization
In L2, only the regularization term differs from the L1 regularization term and is now
Let's set = 1
Here too, the cost function shifts slightly, such that the value of which minimizes the cost function is 2.28571. This nudge prevents the model parameters to be optimized.
The hypothesis function now shifts from the true function, preventing overfitting.
Lambda and "feature selection"
The we saw in L1, L2 is the regularization strength. Increasing it makes the model simpler i.e., moves some parameters towards 0 aka feature selection. But there's a simple distinction here
- In L1, increasing moves certain parameters to exactly 0
- In L2 however, increasing moves certain parameters towards 0, but not exactly 0.
Why is that?
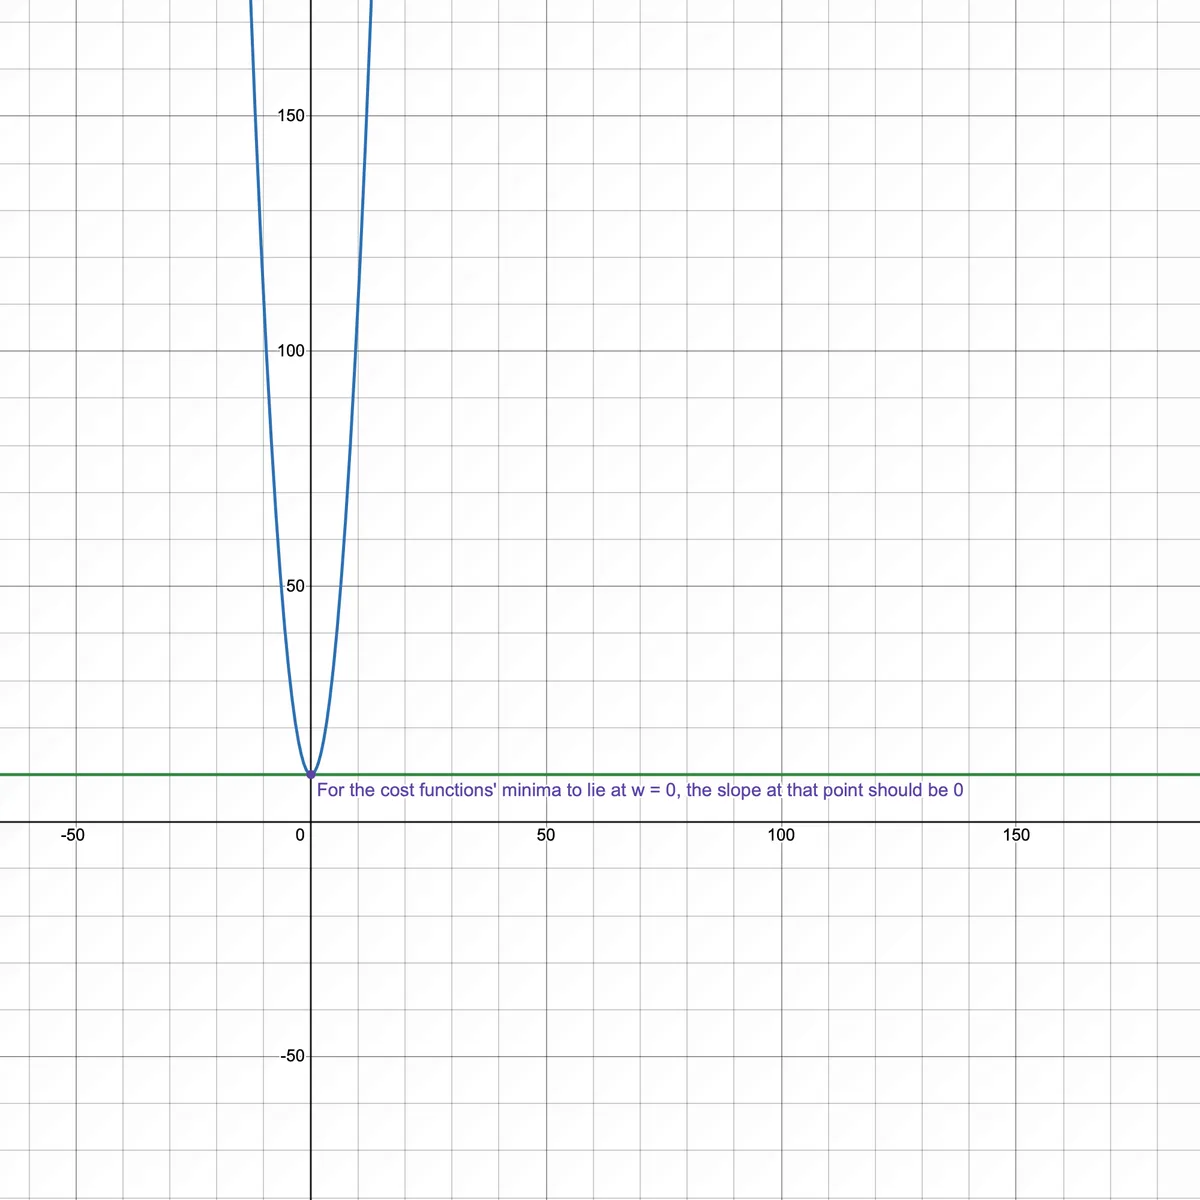
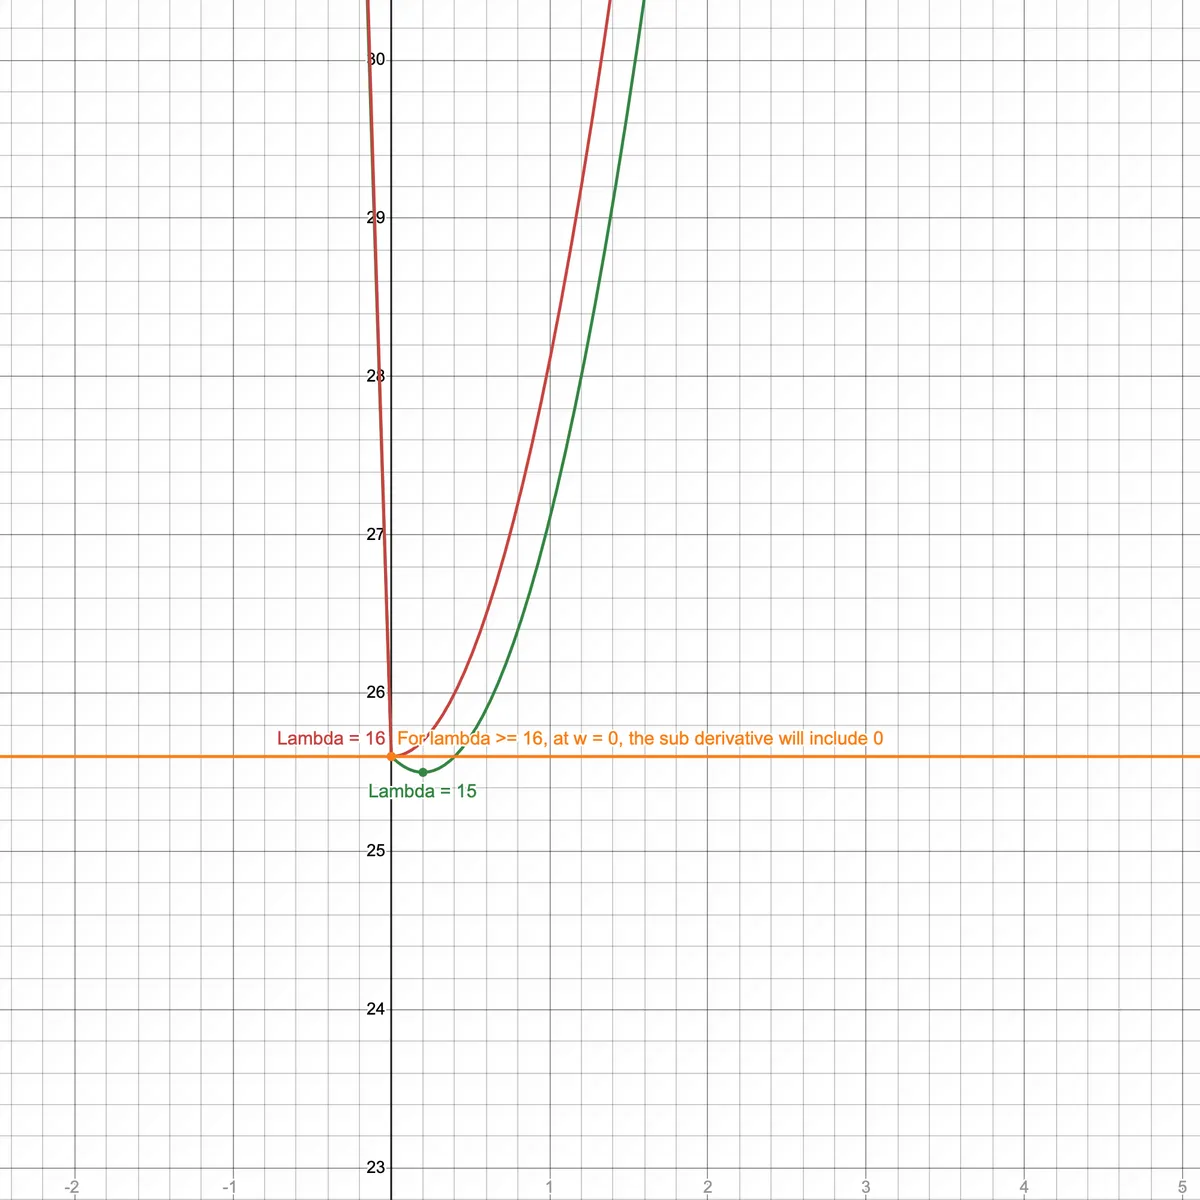
Let's take the same cost function from above. At some value of , the slope of the cost function for > 0 should be > 0 and < 0 should be < 0. This has to hold true for the slope/derivative at = 0 to be 0.
Derivative of L1 regularized cost function
For
And for
Since this is an absolute value function, the function at is non differentiable. The slope could be in the range
For a , the slope range will include 0. Which means for at the slope is 0 i.e., the minimum of cost function is found at . This is how for large lambda values, feature selection happens in L1!
Derivative of L2 regularized cost function
In L2 regularization, the derivative of the cost function is
Let's set derivative to 0 (to find minimum):
Solve for :
In this case, w = 0 iff tends to infinity. Hence, in L2 regularization, parameters are rarely pushed to exactly 0.
With Gratitude
To my family and friends for their support
Sources